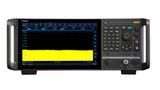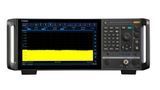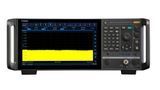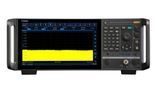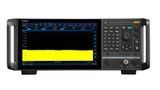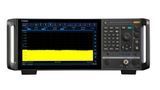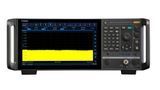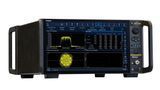
Application Note AN-001
Noise Figure Measurement Using the Y-Factor Method
Practical Guide Using Ceyear 4052 / 4082 Signal & Spectrum Analyzers

1. Introduction
Modern RF and microwave receivers are designed to detect extremely weak signals while introducing as little additional noise as possible. The ability of a receiver or RF component to preserve the signal-to-noise ratio is commonly characterized by its Noise Figure (NF).
Noise Figure is one of the most important performance parameters for low-noise amplifiers (LNAs), receiver front ends, frequency converters, satellite receivers, radar systems, and wireless communication equipment. A lower Noise Figure improves receiver sensitivity and increases the probability of detecting weak signals.
The Y-Factor method is the industry-standard technique for Noise Figure measurements. It uses a calibrated noise source that generates two precisely defined noise levels. By comparing the DUT output noise in these two operating states, the analyzer automatically calculates both the Noise Figure and the Gain of the device under test.
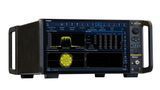
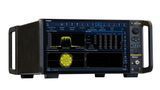
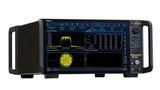
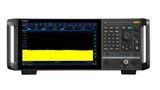
The Ceyear 4052 and Ceyear 4082 Signal & Spectrum Analyzers include an integrated Noise Figure Measurement application that automates the complete measurement process. After the calibrated ENR data has been loaded and the measurement system has been calibrated, the analyzer controls the measurement sequence and displays the Noise Figure and Gain over the selected frequency range.
This application note provides a practical guide for performing Noise Figure measurements using the Ceyear 4052/4082 analyzers. The procedure follows the workflow demonstrated in the accompanying training video and is intended to help users quickly perform accurate and repeatable measurements.

Figure 1. Introduction to Noise Figure measurements using the Ceyear 4052/4082 Signal & Spectrum Analyzer.
2. Y-Factor Principle
The Y-Factor method is the most widely used technique for measuring the Noise Figure (NF) of RF and microwave devices. It is standardized, easy to implement, and provides accurate results when used with a calibrated noise source.
The Ceyear 4052 and Ceyear 4082 Signal & Spectrum Analyzers use this method to automatically determine both the Noise Figure and the Gain of the Device Under Test (DUT). Once the measurement has been configured and the system calibration completed, all calculations are performed automatically by the analyzer.
2.1 Basic Measurement Principle
The Y-Factor method is based on comparing the output noise power of the DUT under two known input noise conditions.
A calibrated noise source operates in two states:
- Cold State (Noise OFF) – the output corresponds to the thermal noise level at the reference temperature of 290 K.
- Hot State (Noise ON) – the output includes a precisely known amount of additional noise specified by the Excess Noise Ratio (ENR).
The analyzer measures the DUT output power for both conditions and calculates the ratio between the two measured noise powers.

Figure 2. Basic Y-Factor measurement principle using a calibrated noise source
2.2 Excess Noise Ratio (ENR)
The Excess Noise Ratio (ENR) defines the difference between the Hot and Cold noise states of the calibrated noise source.
Each noise source is supplied with an individual ENR calibration table that specifies the ENR value as a function of frequency.
Before starting the measurement, this calibration data must be loaded into the analyzer. The ENR values are then used during system calibration and the subsequent Noise Figure calculation.
Using incorrect ENR data will directly affect the measurement accuracy.

Figure 3. Loading the ENR calibration data of the noise source.
2.3 Y-Factor Calculation
The analyzer measures two output noise powers:
- PHot — output noise power with the noise source turned ON.
- PCold — output noise power with the noise source turned OFF.
The ratio of these two measurements is called the Y-Factor.

The measured Y-Factor, together with the ENR calibration data, is used internally by the analyzer to determine the Noise Factor of the DUT.
No manual calculations are required during normal operation.
2.4 Noise Figure
The analyzer first calculates the Noise Factor (F) and then converts it into Noise Figure (NF) expressed in decibels.

The resulting Noise Figure is displayed together with the DUT Gain over the selected frequency range.
This fully automated calculation minimizes operator errors and significantly reduces the time required to perform accurate Noise Figure measurements.
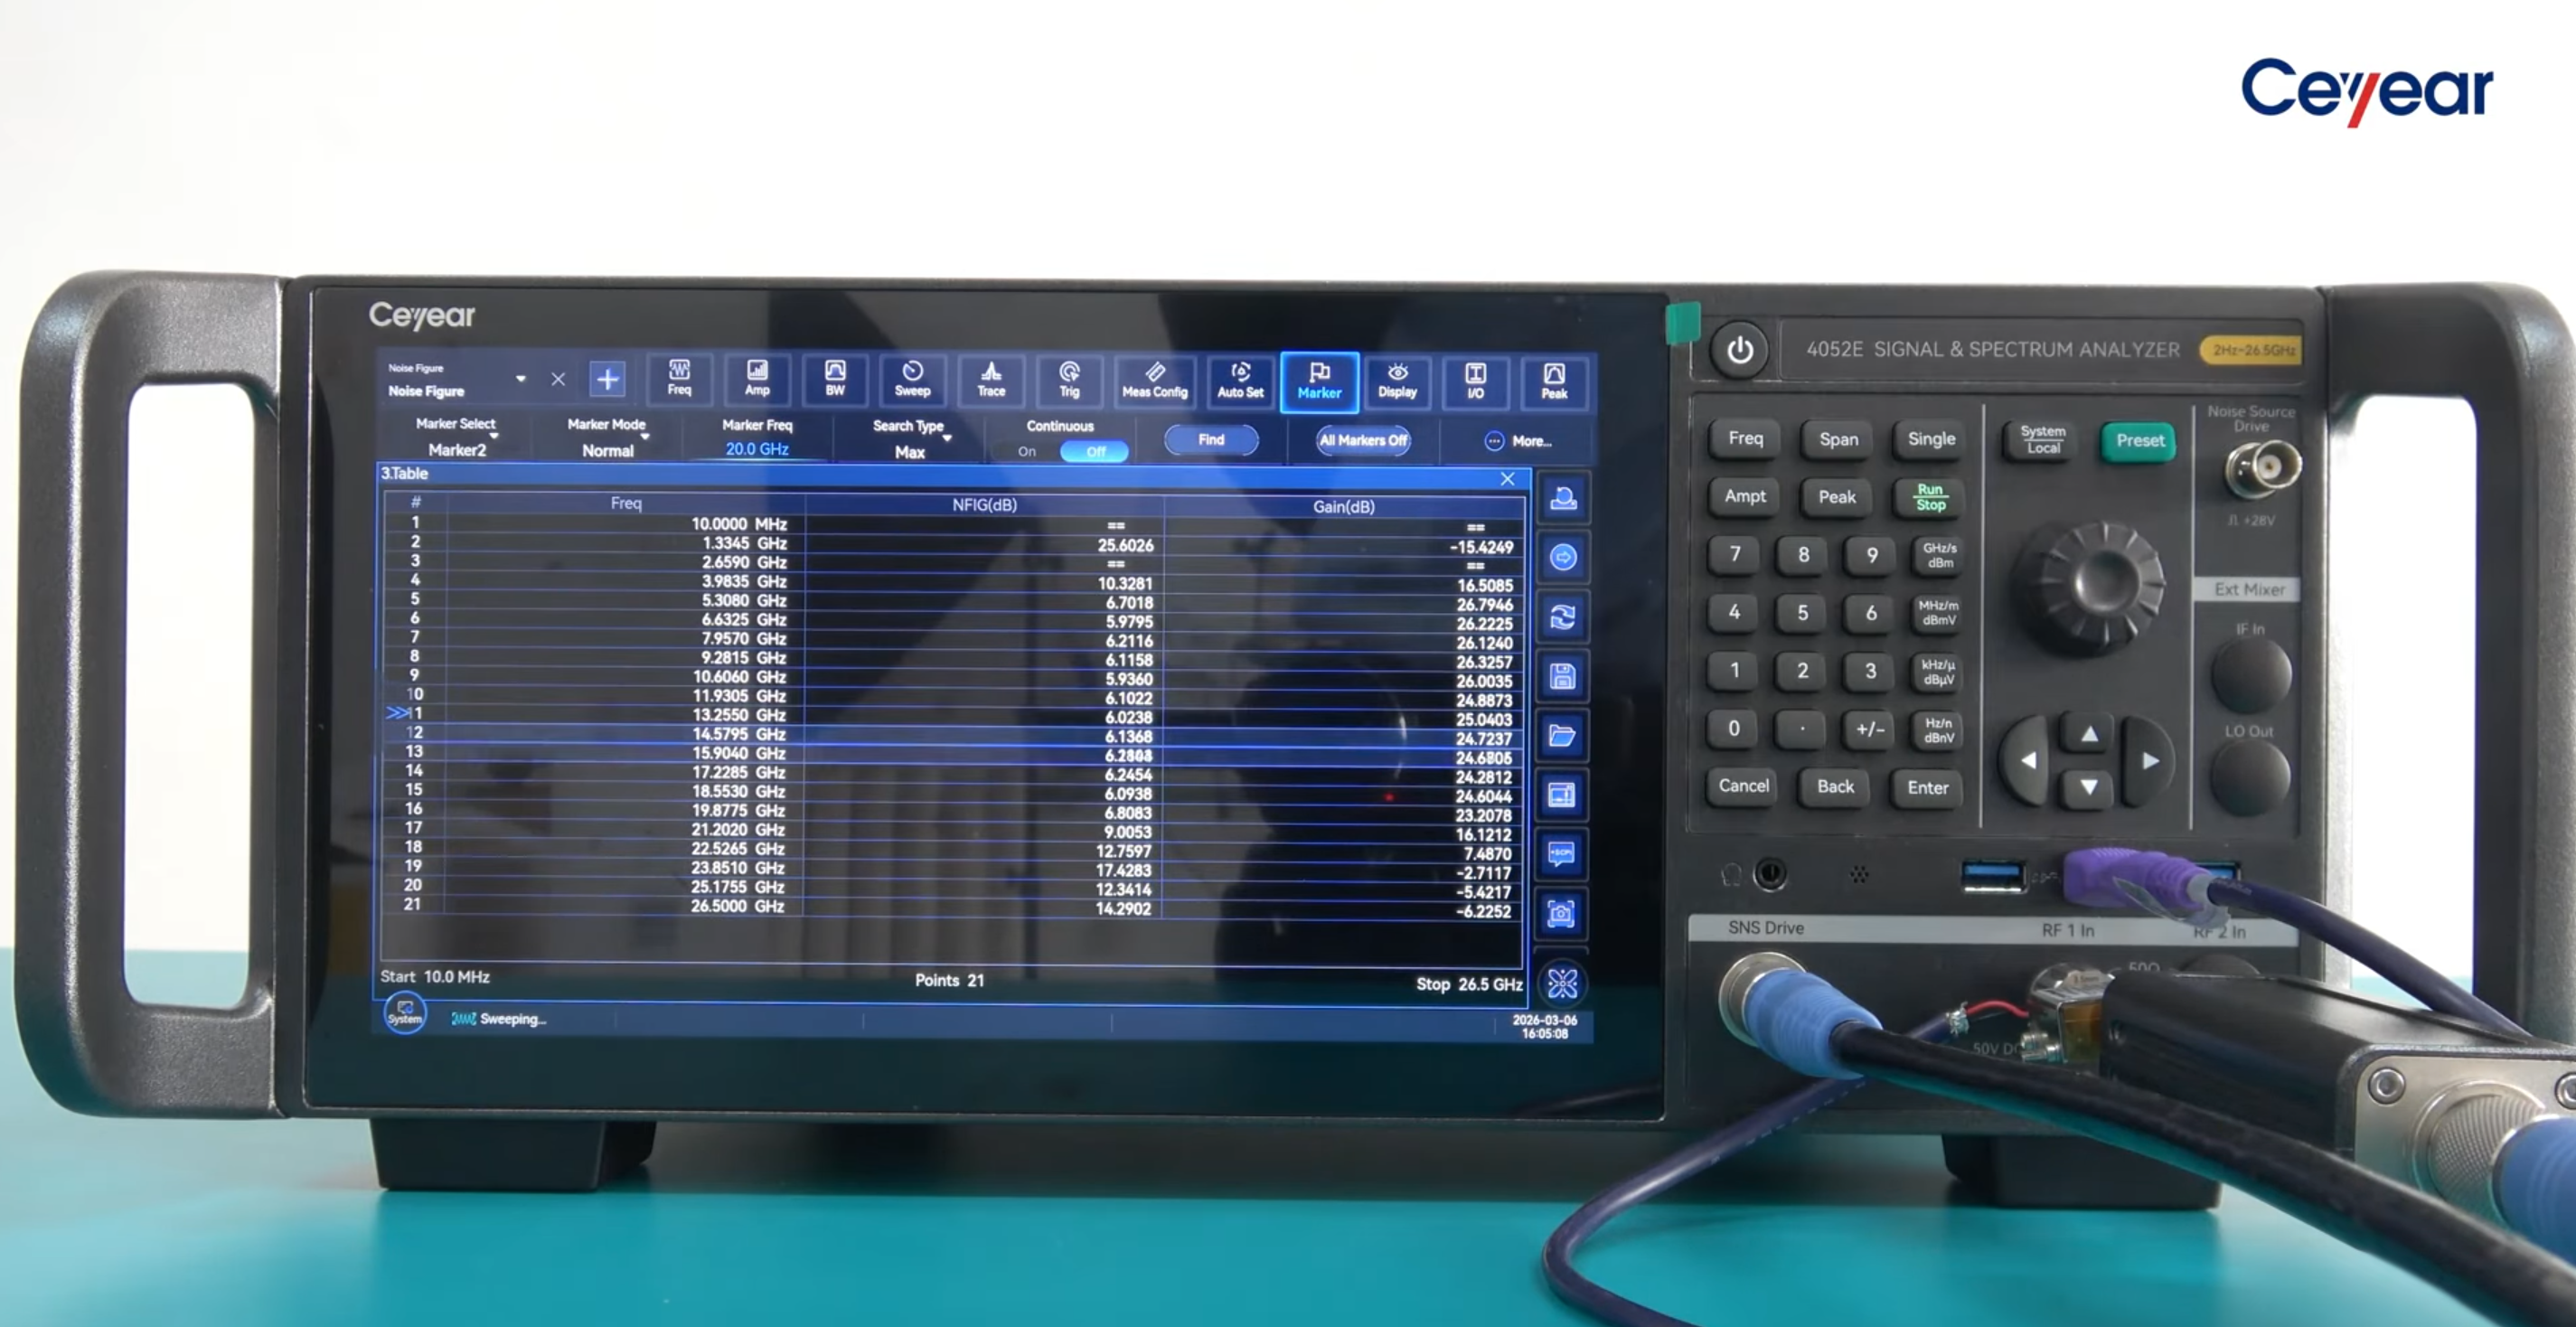
Figure 4. Automatic calculation of Noise Figure and Gain using the Y-Factor method.
2.5 Summary
The Y-Factor method combines a calibrated noise source with two known noise states and an automated measurement algorithm implemented in the Ceyear 4052/4082 analyzers. After loading the ENR calibration data and completing system calibration, the analyzer automatically controls the measurement sequence, calculates the Y-Factor, and displays the DUT Noise Figure and Gain without requiring any manual computation.
3. Test Equipment
Before performing a Noise Figure measurement, ensure that all required test equipment is available and properly connected. The measurement accuracy depends not only on the analyzer itself, but also on the quality and calibration status of the accessories used during the test.
The measurement system demonstrated in this application note consists of a Ceyear 4052/4082 Signal & Spectrum Analyzer, a calibrated Noise Source, the Device Under Test (DUT), and high-quality 50 Ω RF interconnection cables.
Only calibrated accessories should be used when accurate Noise Figure measurements are required.
3.1 Required Equipment
Table 1 summarizes the equipment used throughout this application note.
| Equipment | Purpose |
| Ceyear 4052 or Ceyear 4082 Signal & Spectrum Analyzer | Noise Figure and Gain measurement |
| Calibrated Noise Source | Generates the Hot and Cold noise states required for the Y-Factor method |
| Device Under Test (DUT) | RF component being characterized |
| 50 Ω RF Coaxial Cable(s) | Connects the Noise Source, DUT and Analyzer |
| DC Power Supply (if required) | Provides operating bias for active DUTs |
Table 1. Required Test Equipment
3.2 Ceyear 4052 / 4082 Signal & Spectrum Analyzer
The Ceyear 4052 and Ceyear 4082 analyzers include an integrated Noise Figure Measurement application that automates the complete measurement procedure.
The analyzer performs:
- Noise Source control
- ENR calibration data processing
- System calibration
- Automatic Y-Factor calculation
- Noise Figure calculation
- Gain measurement
- Result display and storage
This significantly reduces measurement time while minimizing operator errors.
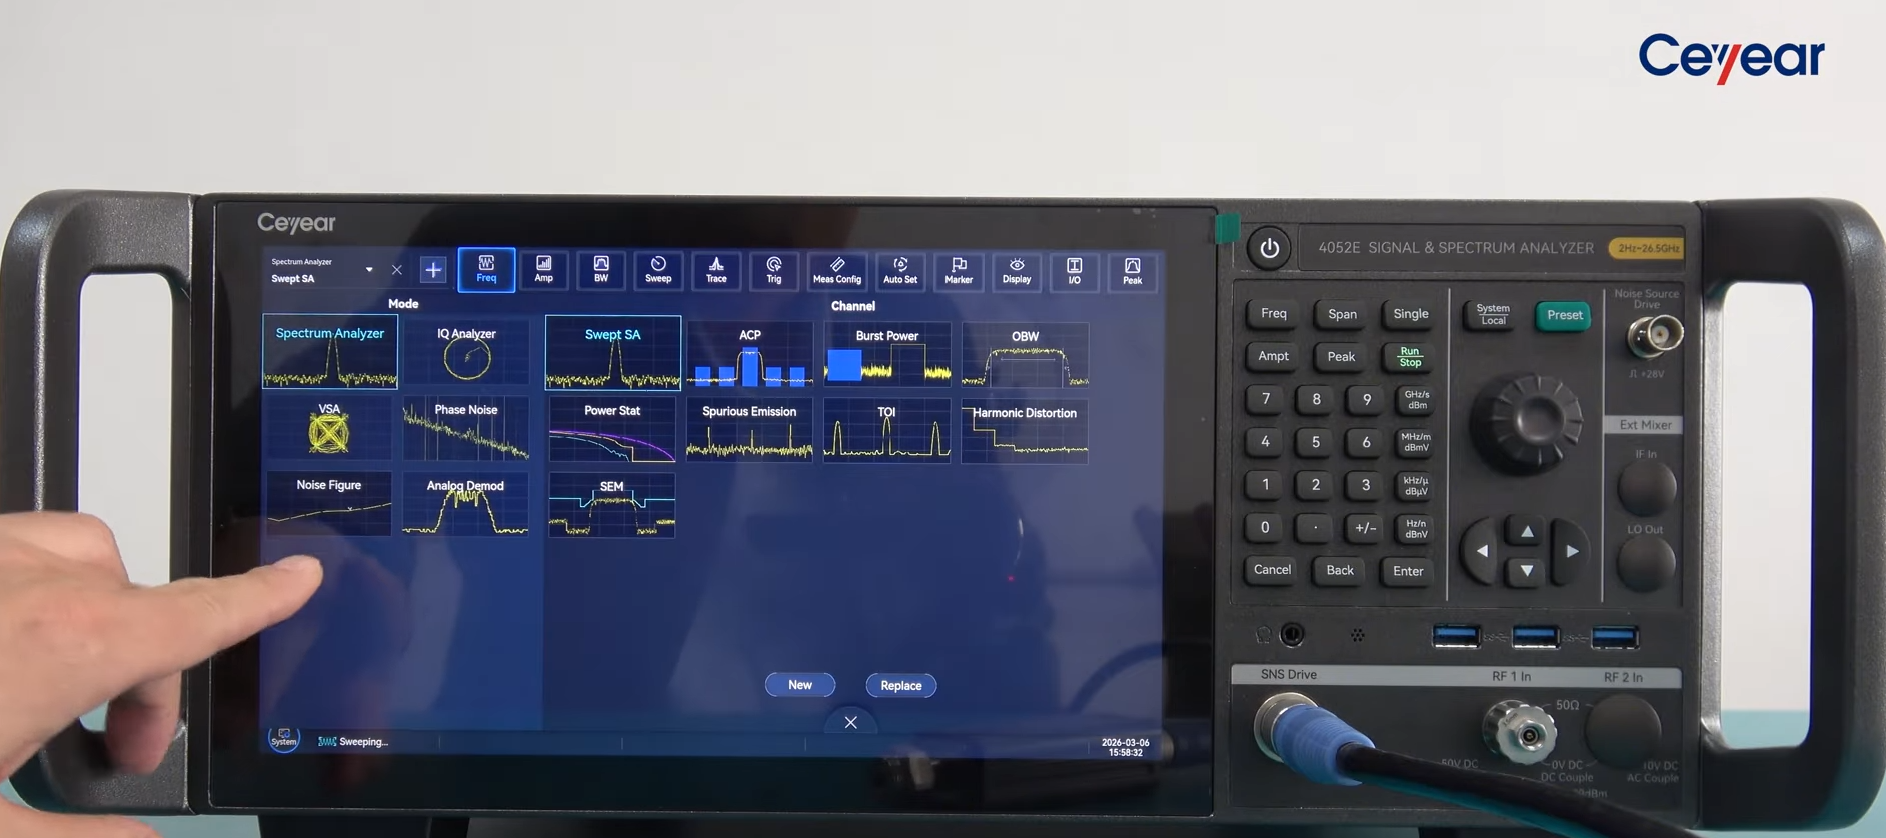
Figure 5. Ceyear 4052/4082 Signal & Spectrum Analyzer used for Noise Figure measurements.
3.3 Calibrated Noise Source
The calibrated Noise Source is the reference device used to generate two accurately known input noise levels.
Each Noise Source is supplied with its own ENR calibration data, which must be loaded into the analyzer before performing the measurement.
The calibration data compensates for the frequency-dependent ENR characteristics of the Noise Source and ensures accurate Noise Figure calculations.
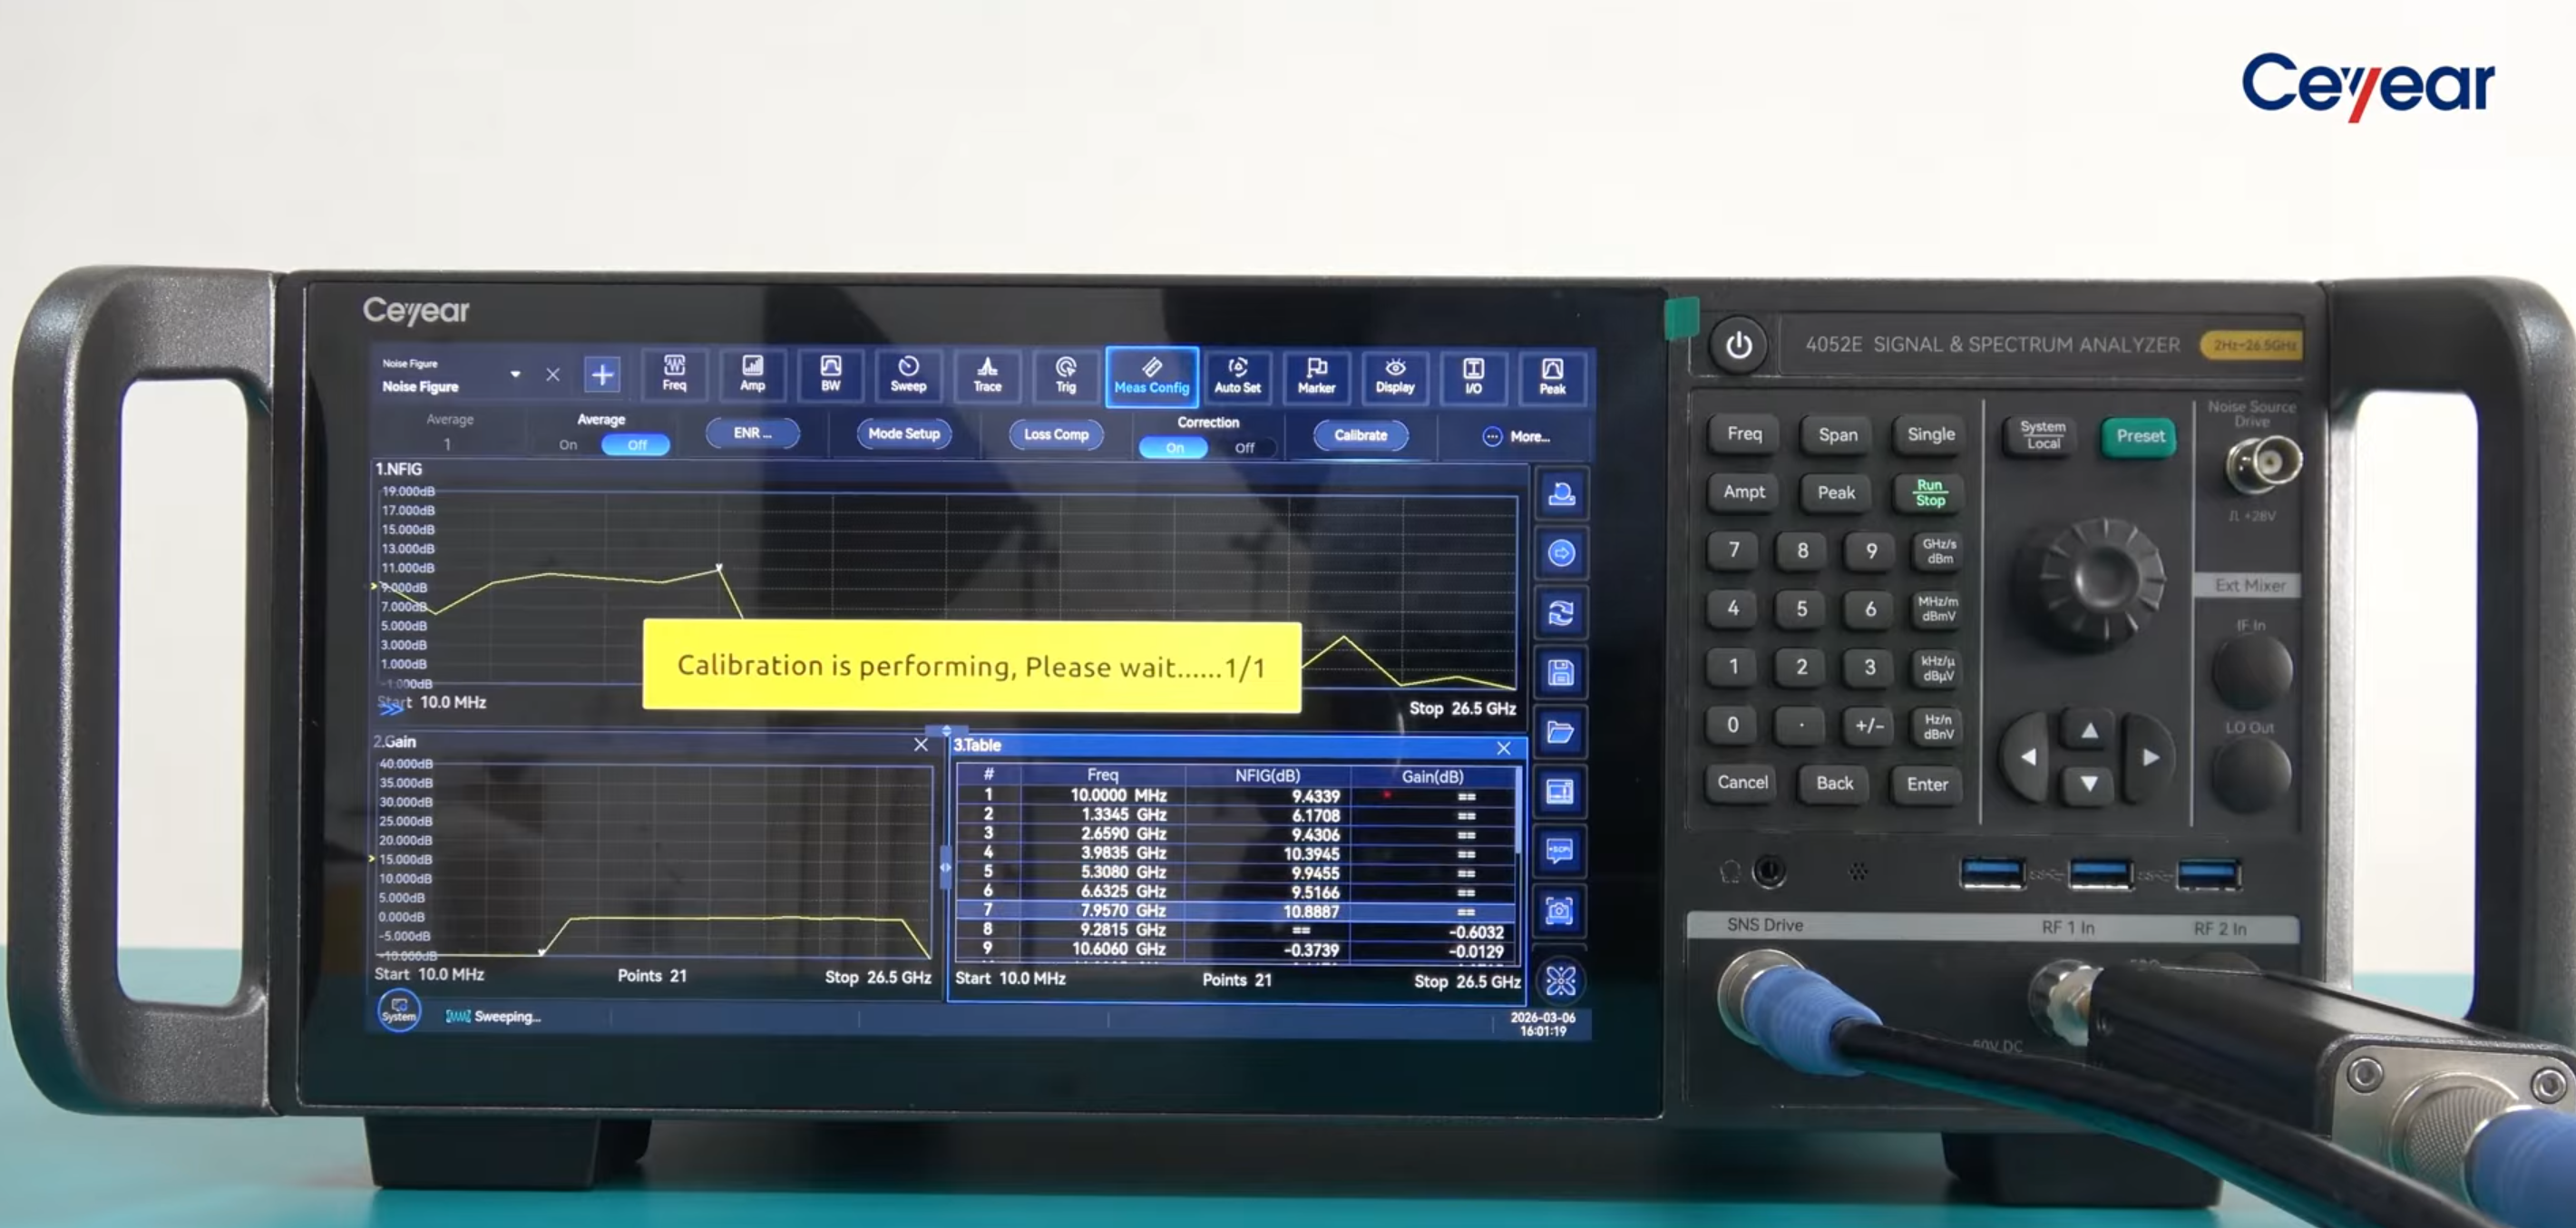
Figure 6. 6. System calibration in progress using the calibrated Noise Source.
3.4 Device Under Test (DUT)
The Device Under Test (DUT) may be any RF or microwave component whose Noise Figure is to be measured.
Typical DUTs include:
- Low Noise Amplifiers (LNAs)
- RF Amplifiers
- Receiver Front Ends
- Frequency Converters
- RF Modules
- Software Defined Radios (SDRs)
Before starting the measurement, verify that the DUT is operating under its normal bias conditions and has reached thermal stability.
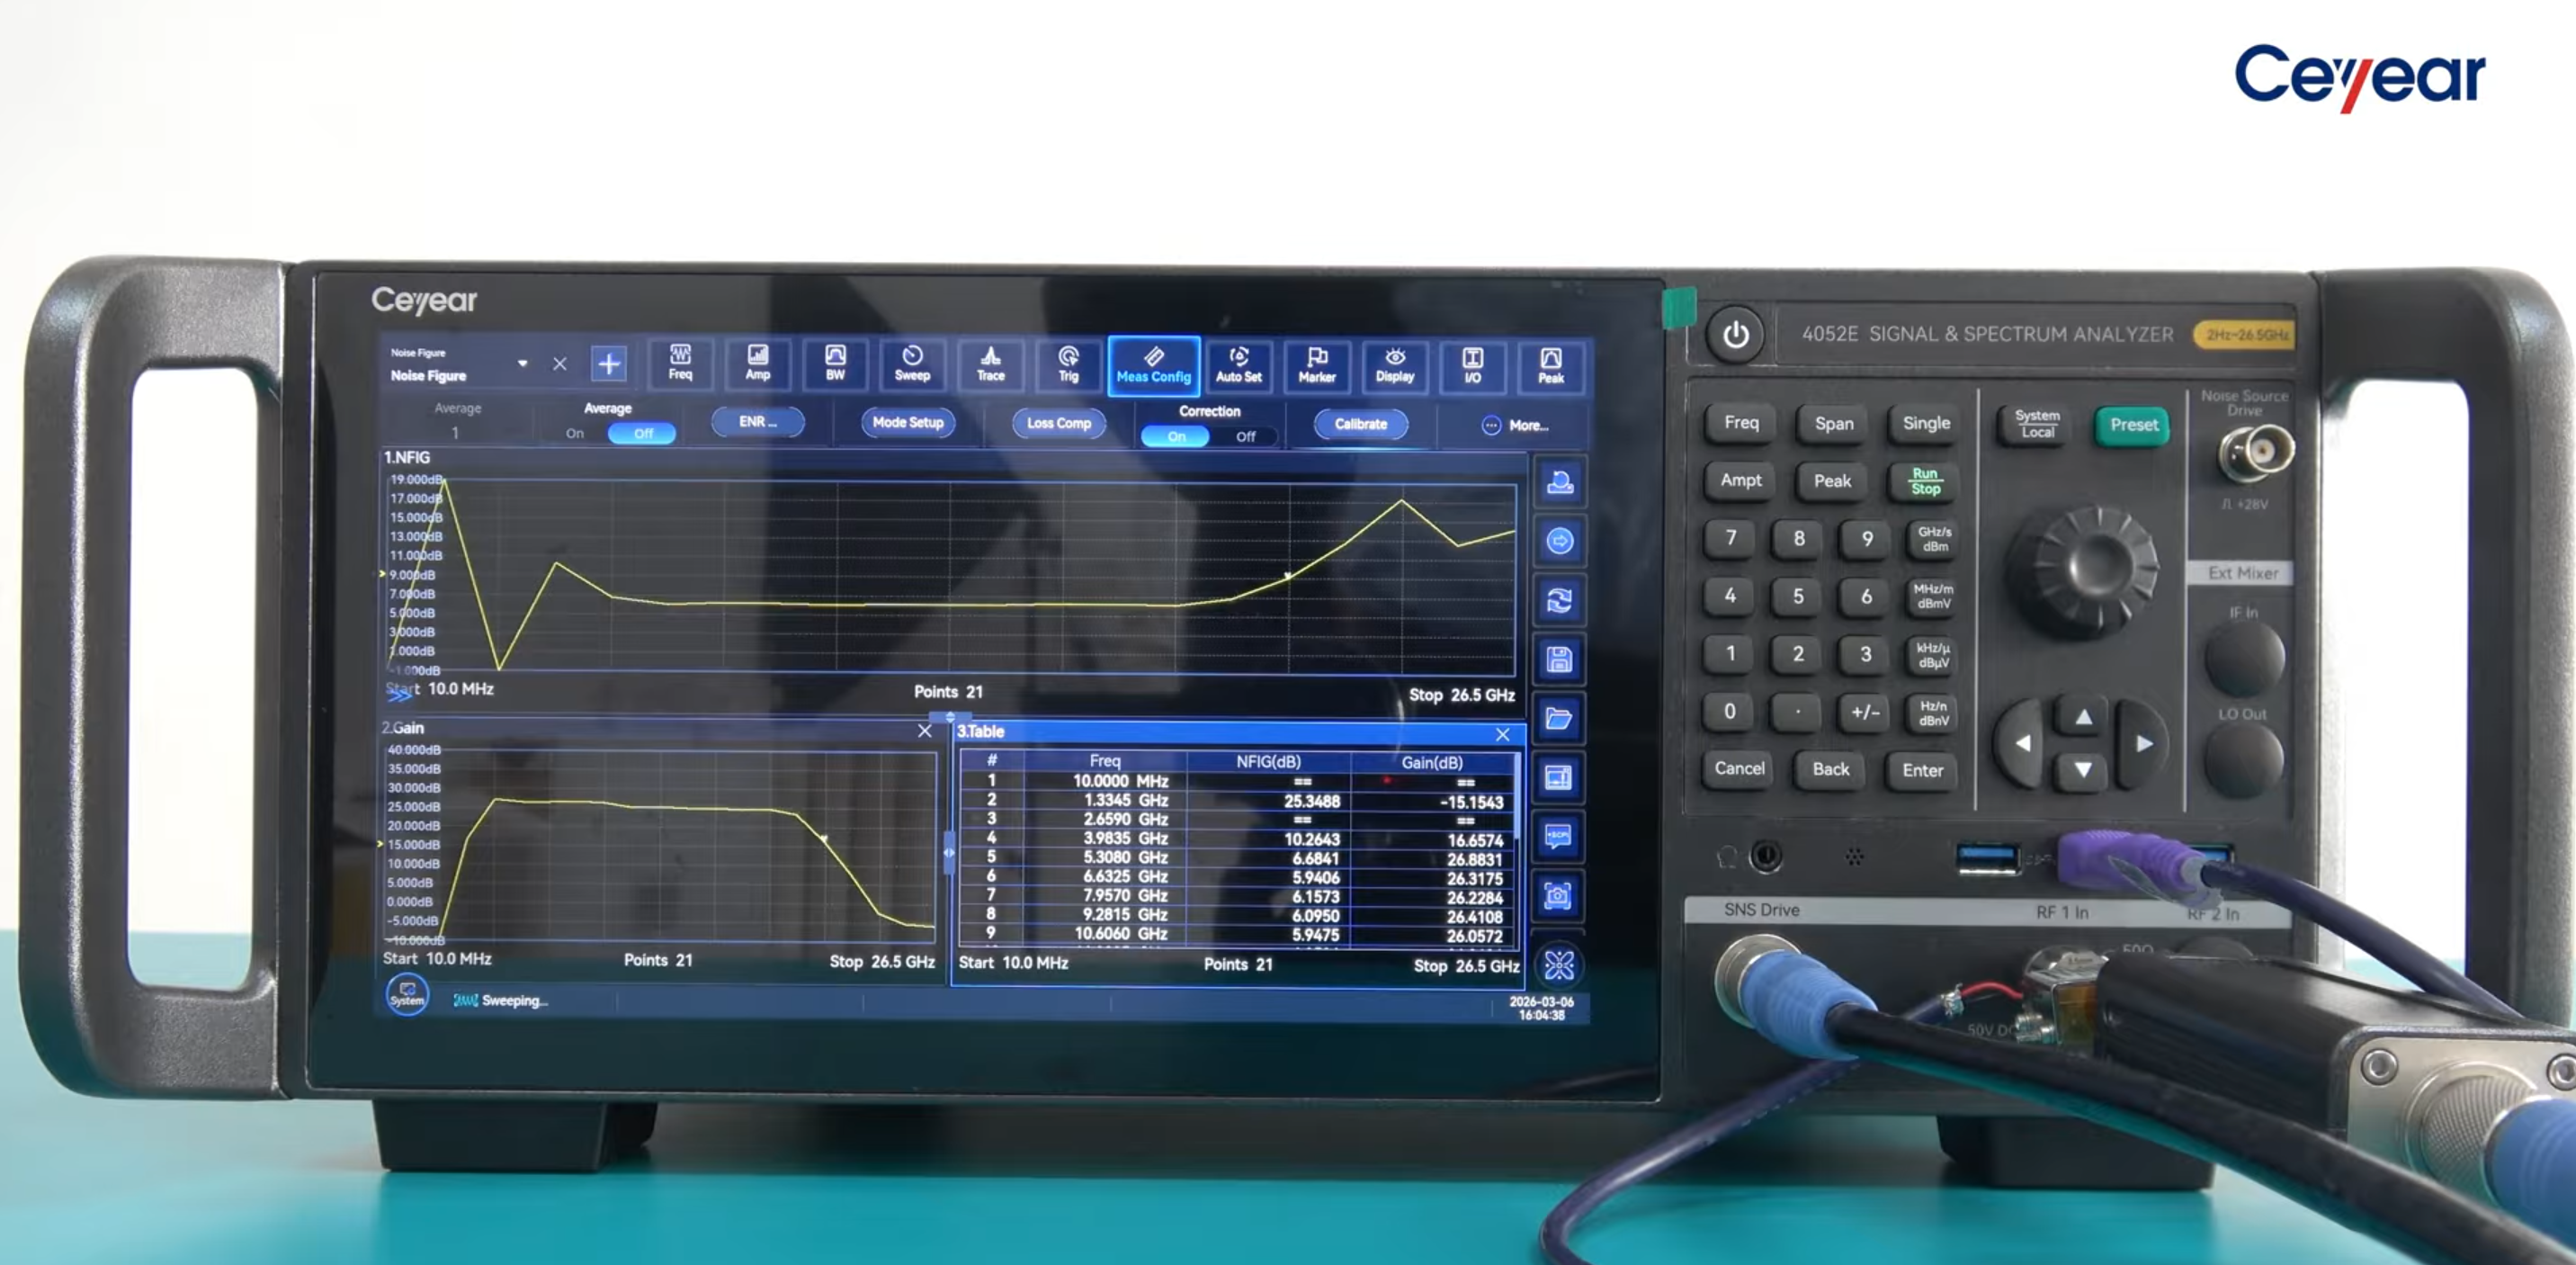
Figure 7. Typical DUT connection for Noise Figure measurements.
3.5 RF Interconnections
The quality of the RF interconnections has a direct impact on measurement accuracy.
For best results:
- use high-quality 50 Ω RF cables;
- minimize cable length whenever possible;
- avoid unnecessary RF adapters;
- inspect and clean RF connectors before use;
- ensure that all connections are securely tightened.
Following these recommendations helps reduce mismatch uncertainty and improves measurement repeatability.
3.6 Measurement Configuration Overview
Before starting the measurement, verify that:
- the analyzer has completed its warm-up period;
- the correct Noise Figure application is selected;
- the calibrated Noise Source is connected correctly;
- the DUT is powered and operating normally;
- the ENR calibration data is available.
4. Measurement Procedure
This section describes the complete Noise Figure measurement procedure using the Ceyear 4052/4082 Signal & Spectrum Analyzer. The sequence follows the workflow demonstrated in the training video and can be used as a practical guide for routine laboratory measurements.
4.1 Launching the Noise Figure Application
Power on the analyzer and allow it to complete the recommended warm-up period.
From the main measurement menu, select the Noise Figure Measurement application.
After the application starts, the analyzer displays the dedicated Noise Figure measurement interface, where all measurement parameters can be configured.
Verify that the correct measurement mode has been selected before continuing.

Figure 8. Launching the Noise Figure Measurement application.
4.2 Configuring Measurement Parameters
Configure the measurement according to the operating frequency range of the DUT.
Typical parameters include:
- Start Frequency
- Stop Frequency
- Frequency Span
- Number of Measurement Points (if applicable)
Select a frequency range that completely covers the operating bandwidth of the DUT.
After all parameters have been entered, verify the settings before proceeding.
4.3 Loading the ENR Calibration Data
Load the ENR calibration data supplied with the calibrated Noise Source.
The analyzer uses this calibration table to compensate for the frequency-dependent characteristics of the Noise Source.
Verify that:
- the correct ENR file has been selected;
- the frequency range matches the Noise Source specifications;
- the displayed ENR values correspond to the calibration certificate.
Using incorrect ENR data will reduce measurement accuracy.

Figure 9. Loading the ENR calibration data.
4.4 Performing System Calibration
After the ENR calibration data has been loaded and the measurement setup has been verified, perform the system calibration.
During this process the analyzer automatically controls the Noise Source and characterizes the complete measurement system.
Wait until the analyzer indicates that the calibration has been completed successfully.
If a calibration error occurs, verify:
- RF connections;
- Noise Source operation;
- ENR calibration data.
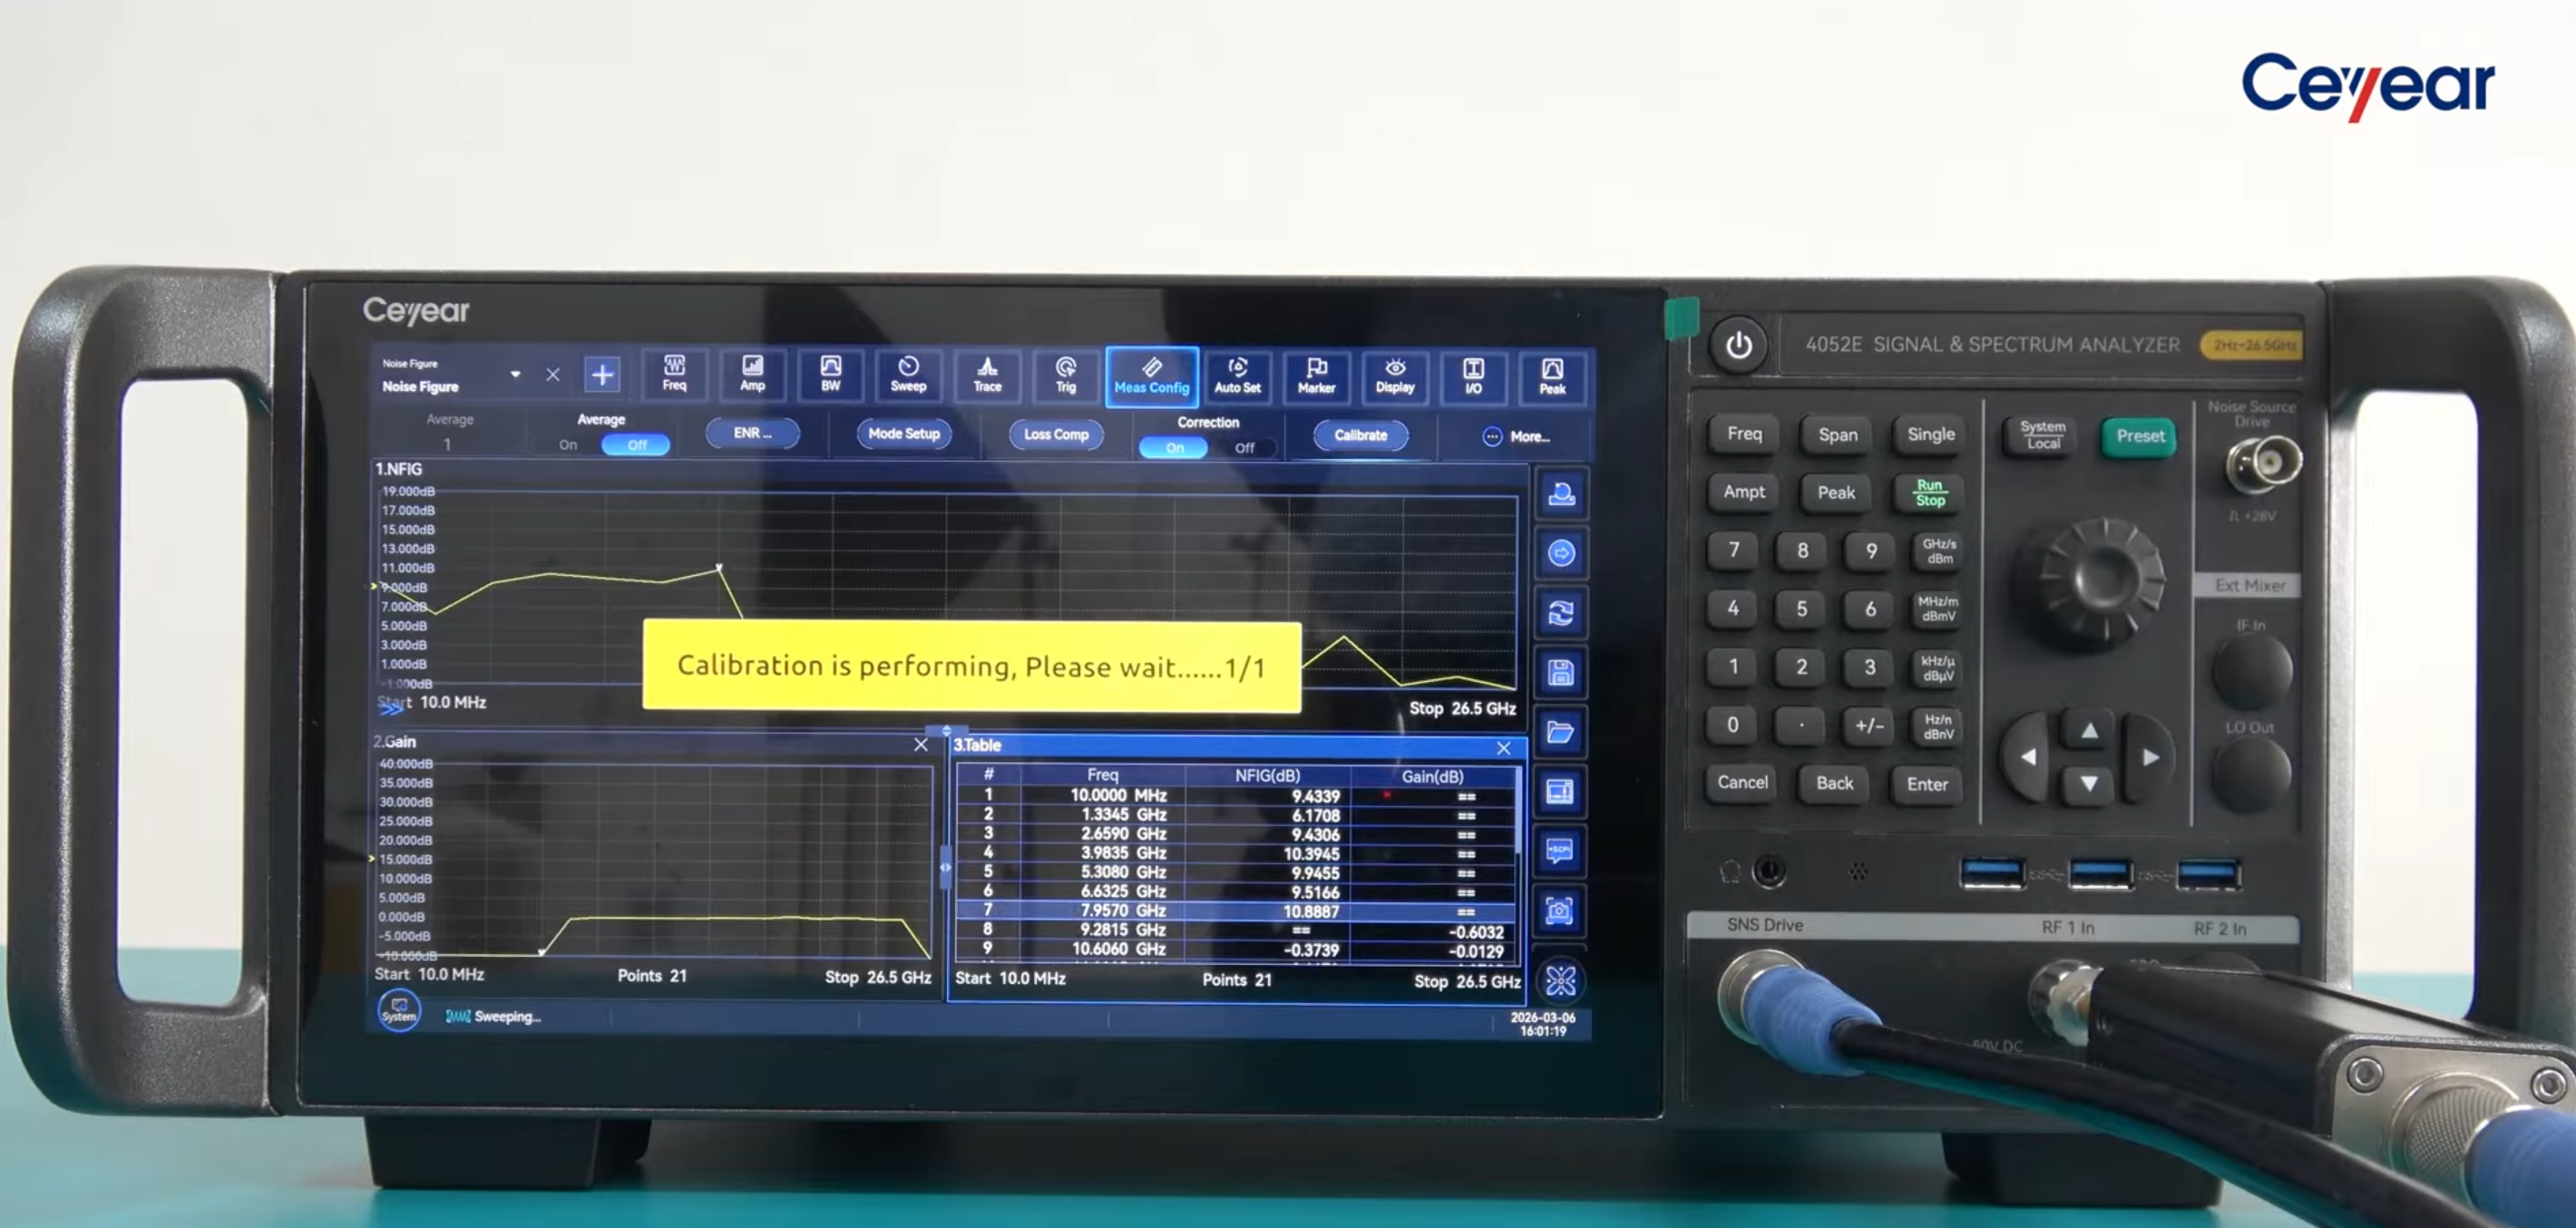
Figure 10. System calibration in progress.
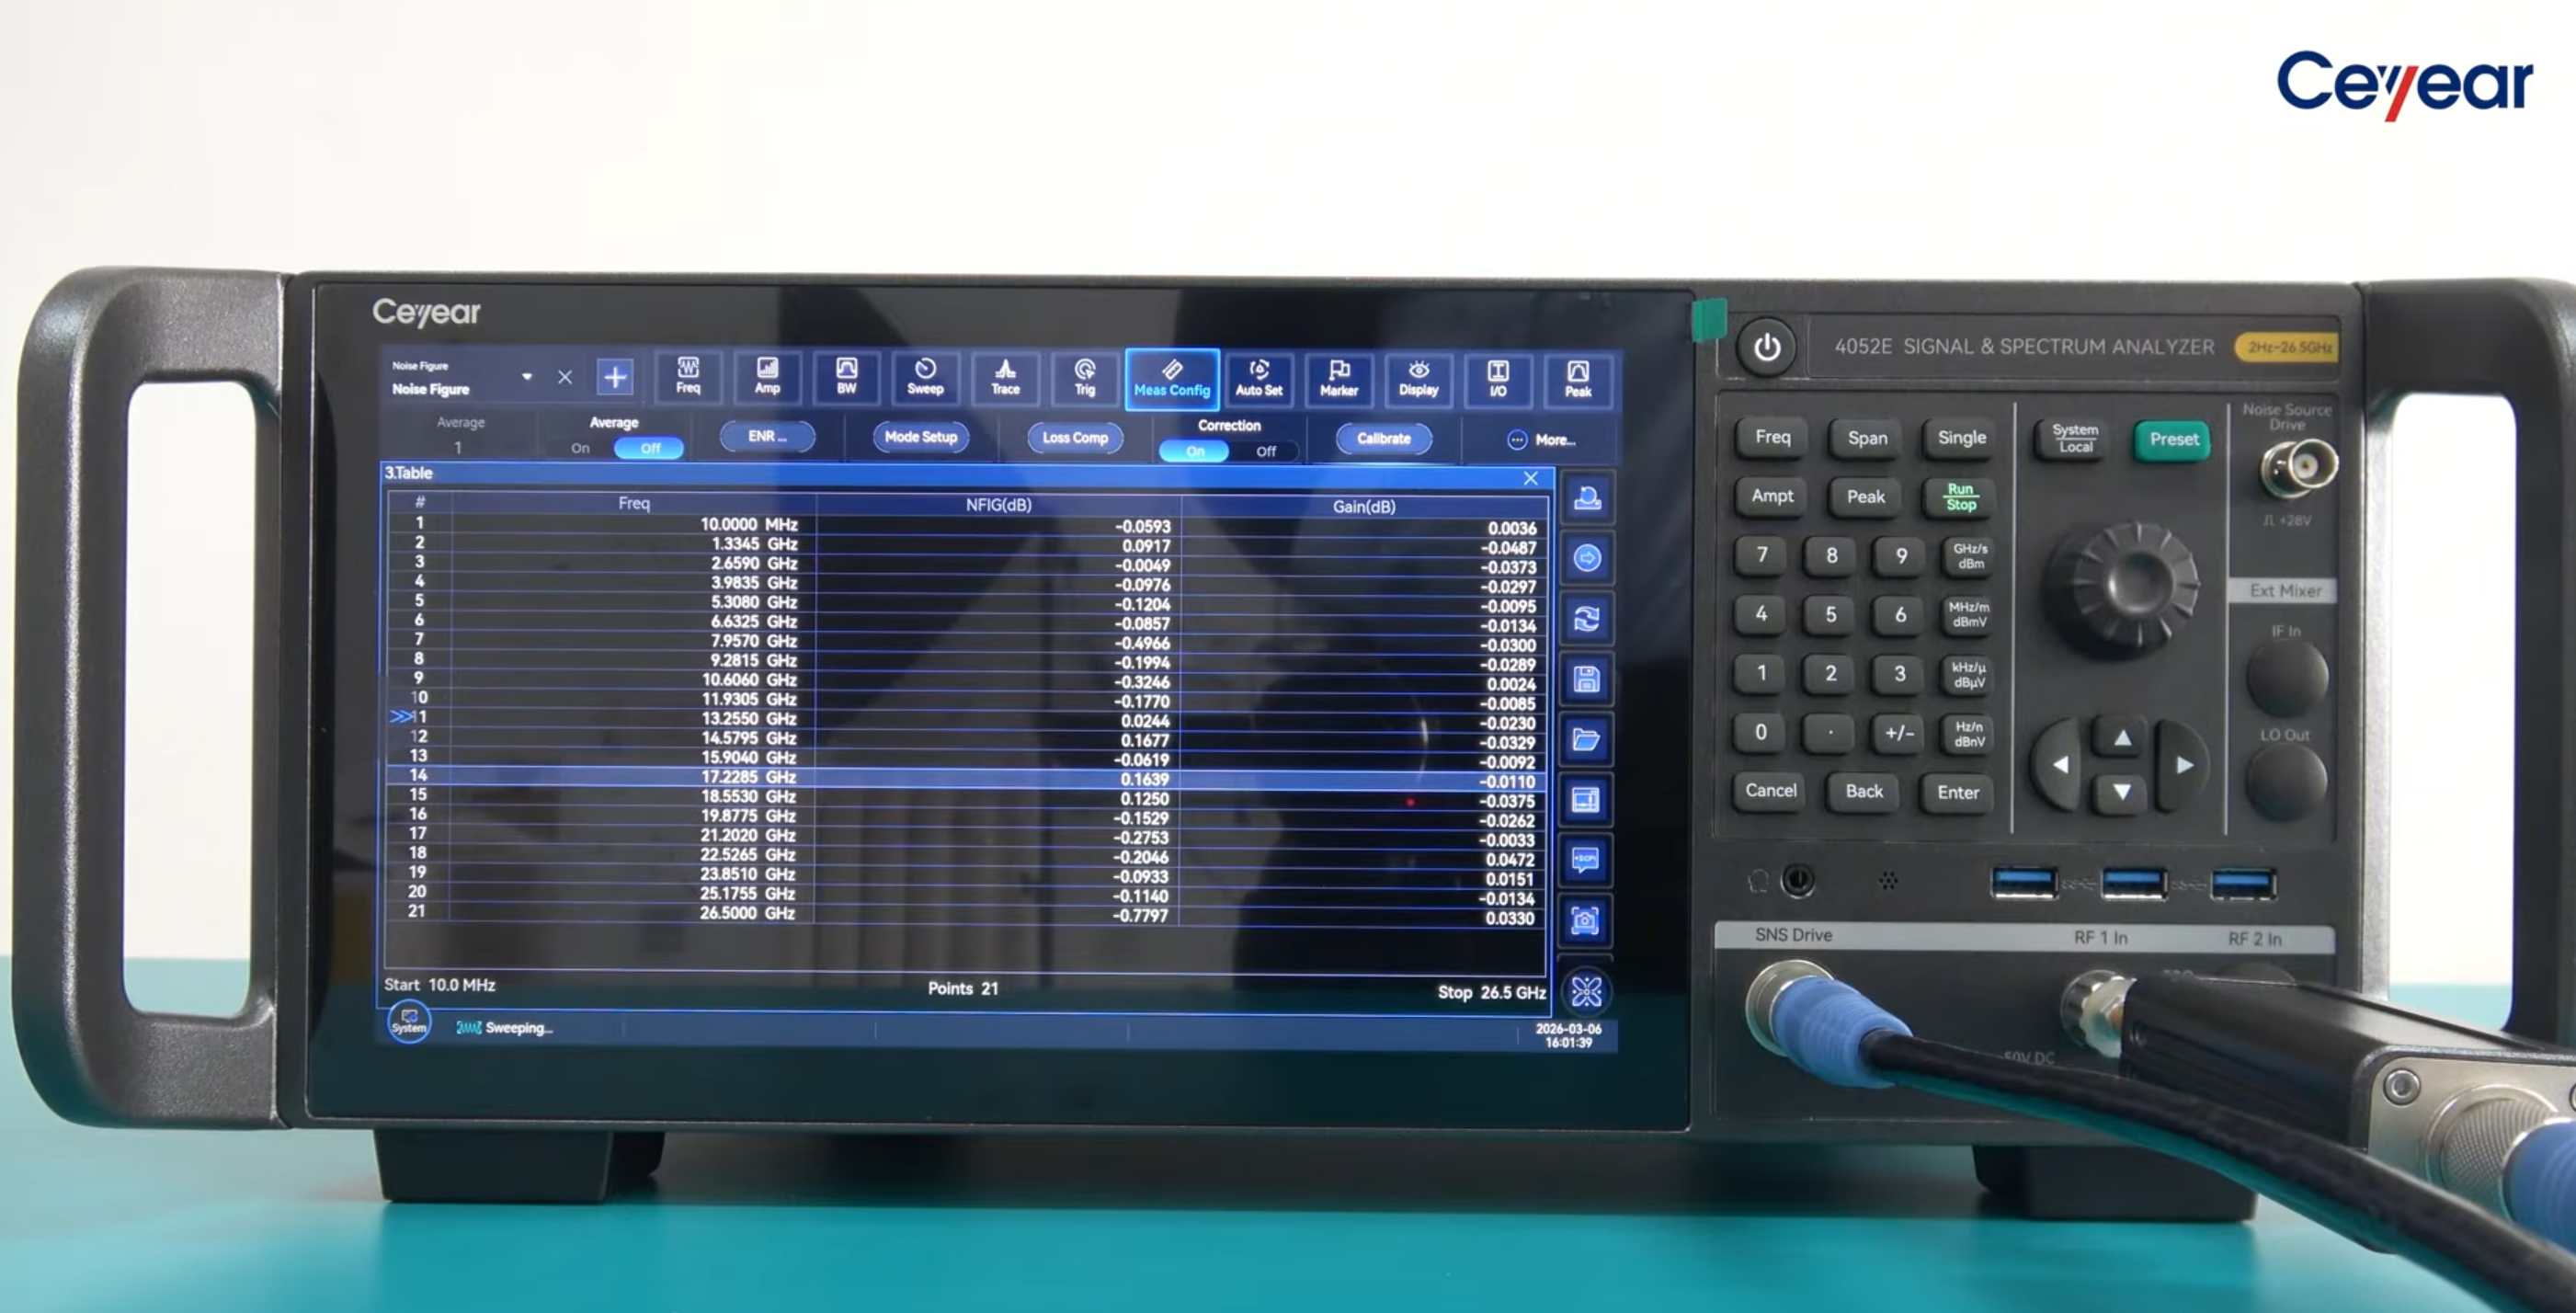
Figure 11. System calibration completed successfully.
4.5 Connecting the Measurement System and Starting the Measurement
Connect the measurement system using the following sequence:
- Connect the calibrated Noise Source to the DUT input.
- Connect the DUT output to the analyzer RF input.
- Apply power to the DUT if required.
- Verify all RF connections.
Before continuing, confirm that the DUT is operating normally and that all RF connectors are securely tightened.

Figure 12. Noise Figure measurement in progress.
4.6 Viewing the Measurement Results
After the measurement is completed, the analyzer automatically displays:
- Noise Figure
- Gain
- Frequency axis
- Marker information
Use markers to read the exact Noise Figure and Gain values at any frequency.
If necessary, repeat the measurement to verify repeatability.

Figure 13. Viewing the Noise Figure measurement results with marker measurement capability.

Figure 14. Table of measured Noise Figure and Gain values.
4.7 Saving the Results
After confirming that the measurement results are valid, save the measurement for future reference.
Depending on the analyzer configuration, the measurement can be stored as:
- Screenshot
- Trace data
- Measurement file
Saving the measurement ensures that the results can be reviewed later or included in technical documentation.
4.8 Measurement Workflow Summary
The complete Noise Figure measurement procedure consists of the following steps:
- Launch the Noise Figure Measurement application.
- Configure the measurement frequency range.
- Load the ENR calibration data.
- Perform system calibration.
- Connect the measurement system and Starting the Neasurement
- Review the Noise Figure and Gain results.
- Save the measurement.
Following this sequence ensures accurate, repeatable and reliable Noise Figure measurements using the Ceyear 4052/4082 Signal & Spectrum Analyzer.
5. Best Measurement Practices
Accurate Noise Figure measurements require not only a properly configured analyzer but also careful attention to the measurement setup and operating conditions. Following the recommendations below will help achieve repeatable and reliable measurement results.
5.1 Allow Sufficient Warm-Up Time
Allow the analyzer and all active measurement equipment to reach thermal stability before performing calibration.
Temperature drift may affect both the analyzer and the DUT, leading to changes in the measured Noise Figure.
5.2 Use the Correct ENR Calibration Data
Always verify that the ENR calibration file corresponds to the connected Noise Source.
Using incorrect ENR data is one of the most common causes of inaccurate Noise Figure measurements.
If multiple Noise Sources are available in the laboratory, clearly identify each calibration file to prevent operator errors.
5.3 Minimize RF Losses
Use high-quality 50 Ω RF cables with the shortest practical length.
Avoid unnecessary adapters or connectors whenever possible, since every additional RF interface increases insertion loss and mismatch uncertainty.
Inspect and clean RF connectors regularly to ensure stable measurement performance.
5.4 Verify DUT Operating Conditions
Before calibration and measurement, confirm that the Device Under Test is operating under its normal conditions.
For active devices, verify:
- Supply voltage
- Bias current
- Operating temperature
- RF operating frequency
Incorrect bias conditions may significantly change both the Gain and the Noise Figure of the DUT.
5.5 Perform Calibration After Changing the Setup
Whenever any component of the measurement setup is changed—including the RF cable, Noise Source, DUT, or adapter—the system should be recalibrated before performing new measurements.
Calibration is only valid for the measurement configuration in which it was performed.
5.6 Verify Measurement Repeatability
Repeat the measurement at least once after calibration.
Consistent Noise Figure and Gain results indicate that the measurement setup is stable and that the calibration has been performed correctly.
Significant differences between repeated measurements usually indicate unstable DUT operating conditions, poor RF connections, or an incorrect calibration procedure.
5.7 Save Both Measurement Data and Screenshots
Store both the measurement trace and a screenshot of the analyzer display.
This provides complete documentation of the measurement and simplifies future comparison or troubleshooting.
5.8 Summary
Following these best practices helps minimize measurement uncertainty and improves repeatability when performing Noise Figure measurements using the Ceyear 4052/4082 Signal & Spectrum Analyzers.
6. Conclusion
The Y-Factor method is the industry-standard technique for accurately measuring the Noise Figure of RF and microwave components. When combined with a calibrated Noise Source, it provides reliable determination of both the Noise Figure and the Gain of the Device Under Test.
The Ceyear 4052 and Ceyear 4082 Signal & Spectrum Analyzers integrate a dedicated Noise Figure Measurement application that automates the complete measurement process, including ENR data processing, system calibration, measurement control, and result calculation.
As demonstrated in this application note, the measurement procedure is straightforward and requires only a few essential steps: configuring the analyzer, loading the ENR calibration data, performing receiver calibration, connecting the DUT, and starting the measurement. The analyzer automatically calculates and displays the Noise Figure and Gain over the selected frequency range.
By following the measurement procedure and best practices described in this document, engineers can obtain accurate, repeatable, and efficient Noise Figure measurements suitable for research laboratories, production testing, product verification, and service applications.